
Observability & Monitoringby SoftwareCrafting
Full-stack visibility into production systems - logs, traces, metrics, and error tracking by SoftwareCrafting.
No sales calls. Written reply in under 4 working hours.
Delivery Time
1-3 weeks
Service Overview
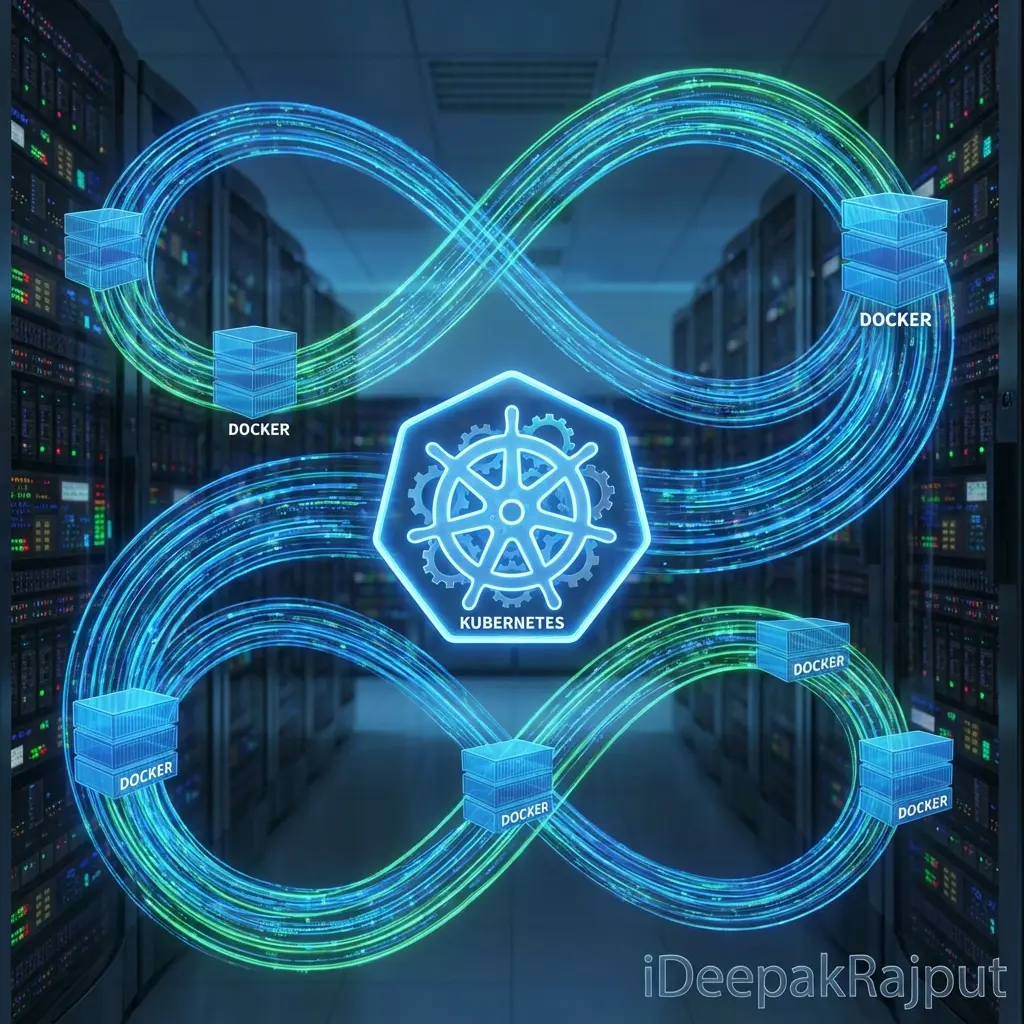
We instrument systems so that when something breaks you can find out what and why in minutes rather than by guessing. That means structured logs with consistent fields you can actually query, distributed traces that follow a request across every service it touches, metrics that reflect what users experience rather than what is easy to measure, and alerts tied to symptoms your customers would notice instead of every CPU spike. We build on OpenTelemetry so instrumentation is portable and you are not locked into one vendor, and we work with Grafana, Datadog, Sentry, Prometheus, and the major managed backends. The part teams usually skip is the operational layer: service level objectives with error budgets, dashboards designed for the questions asked during an incident rather than every metric available, runbooks attached to each alert, and an on call rotation that does not burn people out. Instrumentation without those is just more data.
Technologies we use
Key Features
- OpenTelemetry instrumentation for traces, metrics, and logs
- Distributed tracing across services, queues, and databases
- Structured logging with consistent, queryable fields
- Service level objectives with error budgets and burn rate alerts
- Dashboards designed around incident questions, not metric inventories
- Alert rules tied to user visible symptoms
- Runbooks linked from every alert with concrete first steps
- Error tracking and release health with Sentry
- Real user monitoring and Core Web Vitals from actual visitors
- Uptime and synthetic checks on critical user journeys
- Log retention and sampling policies that control cost
- On call rotation, escalation policy, and paging setup
- Incident response process and blameless postmortem templates
- Cost review of your existing observability spend
Pricing Snapshot
Starting from ₹15,000 for observability stack setup
- Model: project
- Timeline: 1-3 weeks
Our Delivery Process
We use an agile, transparent process to ensure your project is completed on time and meets exactly your needs.
Current state review
Audit existing logging, metrics, alerting, and incident history to find where visibility actually breaks down.
SLO definition
Agree what reliability means for your users, then define service level objectives and error budgets against it.
Instrumentation
Add OpenTelemetry tracing, structured logging, and metrics across services with consistent conventions.
Dashboards and alerts
Build incident oriented dashboards and symptom based alerts, each linked to a runbook.
On call and process
Set up rotation, escalation, and the incident and postmortem process with your team.
Tuning and handover
Run through real incidents, tune alert thresholds and sampling, and hand over documentation.
Why Choose SoftwareCrafting?
- Root cause found in minutes instead of by guesswork
- One trace showing a request across every service it touched
- Alerts that mean something, so nobody learns to ignore them
- Service level objectives that make reliability a shared, measurable target
- Dashboards that answer the questions asked at three in the morning
- Runbooks so the person on call does not need to be the expert
- Real user performance data rather than lab measurements
- Observability spend controlled through sampling and retention policy
- Vendor portability through OpenTelemetry instead of lock in
- An on call setup your team can sustain
Frequently Asked Questions
We already have logs. Why is that not enough?
Which observability platform should we use?
How do we stop observability costs running away?
What is an SLO and do we need one?
How do we reduce alert fatigue?
Can you help during an actual incident?
Case Studies
See how we've delivered results for our clients.
Guides that support this service
Practical engineering notes connected to observability & monitoring decisions, architecture, and implementation trade-offs.
Related services
Services often paired with Observability & Monitoring
These internal links help buyers and search engines understand the full delivery path around this service.
Solutions & industries
Where teams use observability & monitoring
Explore the industry solutions and locations we deliver this capability for, or talk to a Delhi/India-based senior engineer.
Let's build your
next big thing.
Stop compromising on quality. Talk to our technical directors today and find out how our elite engineers accelerate your observability & monitoring deliverables.
Quick Brief
Start the conversation here
Tell us about your observability & monitoring project and we'll reply with a technical response and next steps.
Your Name
Work Email
What do you need help with?